The post The Data Drop: National phonics results 2025 appeared first on Arbor.
]]>If you’re new here, The Data Drop is our regular blog series where we share insights from our data warehouse, which holds data from over 9,000 schools.
And it won’t come as a shock that the DfE has confirmed that the phonics threshold for 2025 is 32.
–
Overall phonics average
The 2024/25 phonics results show that 81% of students met the expected standard, representing a slight increase from 80.9% in 2023/24. This continues the upward trend we’ve observed since 2021/22, when 76.2% of students achieved the expected standard.
These results are based on data from 180,182 Year 1 students across 4,938 primary schools in the Arbor community, representing a substantial sample of the national picture.

–
Phonics results: Boys vs Girls
The gender gap in phonics performance remains significant in 2024/25. Girls continue to outperform boys, with 84.7% of girls meeting the expected standard compared to 77.5% of boys. This represents a gap of 7.2 percentage points.
Whilst both groups have shown improvement over the four-year period, the gap has remained relatively consistent. In 2021/22, girls achieved 79.2% compared to boys at 73.2% (a 6.0 percentage point gap).

–
Phonics results: Disadvantaged vs not disadvantaged
The attainment gap between disadvantaged and non-disadvantaged pupils remains substantial. In 2024/25, 68.1% of disadvantaged pupils met the expected standard, whilst 85.1% of non-disadvantaged pupils achieved this level.
Notably, the results for disadvantaged pupils showed a slight decrease from 68.7% in 2023/24, whilst non-disadvantaged pupils maintained their upward trajectory from 84.8% to 85.1%.

Phonics results: SEN students
Students with Special Educational Needs (SEN) continue to face significant challenges in phonics achievement. In 2024/25, 47.7% of SEN students met the expected standard, compared to 88.8% of students without SEN.
This represents a gap of 41.1 percentage points. SEN students showed minimal improvement from 47.6% in 2023/24, whilst non-SEN students continued their upward trend from 88.1% to 88.8%.

–
Phonics results: Ethnicity breakdown
The 2024/25 results reveal significant variation in phonics achievement across different ethnic groups:
Top 5 performing groups:
- Asian – Chinese: 90.6%
- Mixed – White and Asian: 86.6%
- Asian – Indian: 85.7%
- White – Any other White background: 83.3%
- Mixed – Any other Mixed background: 83.3%
Below national average:
- White – Irish: 79.7%
- Mixed – White and Black Caribbean: 78.0%
- Any other ethnic group: 77.6%
- Black – Black African: 78.6%
- Black – Any other Black background: 76.2%
- Black – Black Caribbean: 75.2%
Significantly below average:
- White – Gypsy/Roma: 45.6%
- White – Traveller of Irish heritage: 27.3%
The results highlight persistent achievement gaps, with students from Gypsy/Roma and Traveller backgrounds facing particular challenges in phonics attainment.

–
Methodology
We take our insights from Arbor’s Data Warehouse, powered by Snowflake, which contains the anonymised data of schools in the Arbor community. As of today there are 9,355 English schools using Arbor, supporting over 3.3 million students. This data set represents 38.4% of the 24,453 schools in England. Arbor national averages track closely to DfE national averages.
This results analysis was correct as of 24th June 2025 at 2 pm.
The post The Data Drop: National phonics results 2025 appeared first on Arbor.
]]>The post The Data Drop: Which school clubs are the most popular? appeared first on Arbor.
]]>For those that are new here, The Data Drop is our series of blogs where we share insights from our data warehouse (containing the data of over 7,000 schools.)
In this edition, we explored how many schools have different kinds of clubs (excluding breakfast, wraparound and homework clubs.) Perhaps unsurprisingly, the most popular club for all phases was Football Club. As you can see from the lists below, football wasn’t the only club that made it into the top ten of both phases. Though they rank differently for each phases, choir, art, dance, netball, and theatre were among the most popular clubs for both primary and secondary.
Some of the differences are endearingly reflective of phase. From primary to secondary, lego gets swapped for chess, while rugby and badminton are favoured over the younger dodgeball and gym.
The top ten most popular school clubs

Primaries
- Football
- Choir / Singing
- Art / Craft
- Dance
- Netball
- Dodgeball
- Lego
- Gymnastics
- Multi sports
- Drama / Musical Theatre / Performing Arts

Secondaries
- Football
- Netball
- Art / Craft
- Basketball
- Choir / Singing
- Badminton
- Drama / Music Theatre / Performing Arts
- Dance
- Rugby / Tag Rugby
- Chess
Other fun facts about school club popularity:
- Board games clubs made it into the top 20 for both primary and secondary
- Dungeons and Dragons club came in at 13 for secondary schools
- Archery was ranked the 22nd most popular club for primary schools
- Puzzles and UNO clubs were also popular across all schools
–
Methodology
Our data warehouse holds the anonymised data of Arbor’s schools.
Rules:
- We pulled data from schools who have at least one club: 3528 primaries and 621 secondaries
- We have removed club names where the club name free text appears to be used for trips, interventions, revision sessions etc
- We have only included data on primary and secondary schools as there is not enough data on other types
- If a school has five art clubs, e.g. one per year group, they have only been counted once
The post The Data Drop: Which school clubs are the most popular? appeared first on Arbor.
]]>The post The Data Drop: Have GCSE Results been affected by attendance and the pandemic? appeared first on Arbor.
]]>Over the past two years, there’s been a lot going on for both students and schools. These are the first normal “post-COVID” GCSEs, where students will most likely have studied for two years in school.
From our own analysis, we know that student attendance is still an issue for schools, particularly at Key Stage 4.
–

–
As you can see from the chart above, Year 10 and Year 11 attendance at secondary schools is below the national averages for primary and secondary schools.
Note: We have removed Year 11 study leave (June & July 2023)
–
Maths
It’s a varying picture for the grade 4 / 5 borderline students. Compared with 2023, more students are achieving a grade 5 in Mathematics, with the percentage of students achieving a grade 4 dropping slightly.
However, there is a drop off in the number of students achieving grade 8 and grade 9 vs last year. This is in contrast to the A-level results where more students were achieving higher marks.
It’s hard to explain the grade spread here, could it be the shortage of Maths teachers with a degree is affecting Key Stage 4? Are the qualified Maths teachers being deployed to teach A-level?
–

–
–
English
The results are similar in English, where the higher grades have seen a deflation at the expense of the lower grades.
Grade 5 in English Language has seen an increase vs last year, as has grade 4 in English Literature. This may be as a result of students aiming for a “pass” mark in each subject.
A higher percentage of students achieved grade 5 in English Language this year than last year. Could this be a result of effective interventions helping to get those borderline students up to grade 5?
–


–
Languages
I wanted to pay attention to Modern Languages, particularly since it has been reported that there has been less language provision in secondary schools in recent years. Are students taking languages seriously? We know that schools would like them to, but there is a teacher shortage in languages.
From the data, we can see that both French and German have seen the higher-end grades improve on last year. This could be a result of having qualified teachers in certain subjects and not others.
–


–
Humanities
Overall, it’s a mixed set of results for Geography and History. History has improved, where the number of students achieving a ‘string pass’ has increased since 2023, as did the number of students who achieved top marks.
Whilst Geography had more students achieving a grade 6 since last year, all of the other grades awarded grade 4 and above didn’t meet the previous year’s numbers. Again, this may be due to the national shortage of Geography teachers, with non-specialists covering lessons.
–


–
Science
The big takeaway from the sciences is that the Physics results have broadly improved from grade 6 and above (except grade 9). This mirrors the A-level results spread that we saw last week.
Both Chemistry and Biology have broadly fared better towards the higher end of the marks. This could be down to schools prioritising all three sciences across the curriculum.
–


–
Summary
It’s been a diverse picture across each subject. With a few exceptions, on average the higher grades haven’t quite matched last year. This may reflect the difficult few years that our Key Stage 4 students have been through or the continued dip in Key Stage 4 attendance.
It will be interesting to see how the national picture for GCSEs changes over the next two years as Attainment 8 remains, while Progress 8 is sidelined. How will this affect interventions for Year 10 and Year 11? Will it affect the entries and results of next year’s students?
Keep an eye on Arbor’s Data Drop blog as we dive into more of the data. e’ll be releasing a more in-depth analysis of the LKey Stage 4 results later this week.
–
Note:
- To compile this data, we’ve taken average grades and entry counts across a number of exam boards and qualifications and used the award’s “Subject” key to aggregate
- In some cases a result doesn’t have a grade, it will still be counted as an entry, but the result isn’t counted in our analysis
- ‘X’ and ‘U’ grades are not displayed on our charts
- In all cases, we’ve used GCSE data and not BTEC data
- This is an early snapshot of the data and may change. We plan to review this data in the near future. The analysis was correct at 15:30 on 21st August 2024
The post The Data Drop: Have GCSE Results been affected by attendance and the pandemic? appeared first on Arbor.
]]>The post The Data Drop: A Level Results Day 2024 appeared first on Arbor.
]]>As schools continue on the road to recovery after COVID, we wanted to compare the 2023 data to this year’s results to see if the pandemic has had an effect on student’s attainment in certain subjects.
With the recent election of a new Labour government, we were also interested in looking at the take-up of more ‘traditional’ subjects like Mathematics and English. Subjects that the previous government had placed a focus on, compared to more creative subjects such as Music and Art.
Looking at the data, core subjects like English and Mathematics have a much higher take up of entries. Subjects such as Psychology, Business Studies, and Art and Design (that are often studied for the first time by students at A Level) have declined.
Surprisingly – Biology, Chemistry and History entries have declined, even though these are often seen as more ‘traditional’ subjects. This could be due to the increase in Mathematics and English, or the teacher shortage in these subjects.

–
Mathematics
Mathematics A Level has seen an increase in the number of entries this year. This is a surprise as the lack of Maths teachers nationally has been well documented. Is it because students are seeing Mathematics as a more lucrative subject in later life? Or perhaps because of the focus on numeracy at an earlier age?
Grade Distribution

Number of Entries

–
English Language
The number of entries for both English Literature and English Language have increased this year. Potentially at the expense of other academic subjects that require a high level of literacy, such as History. This may be a result of the previous government’s focus on Numeracy and Literacy filtering through to A Levels.
Grade Distribution

Number of Entries

English Literature
Grade Distribution

Number of Entries

Computing
The number of students entered for Computing A Level has increased – perhaps because of the AI revolution?
Grade Distribution

Number of Entries

Physics
Physics entries are also on the up. Is Space X and Tesla making Physics fashionable?
Grade Distribution

Number of Entries

Music
Music entries are down this year. It could indicate a shift in young people’s interests, or, a reaction to the narrowing of the curriculum.
Grade Distribution

Number of Entries

Art and Design
It’s the same for Art and Design. Entries appear to have suffered in favour of subjects seen as more traditionally ‘academic’.
Grade Distribution

Number of Entries

According to the preliminary data, it looks like Physics and Computing are the big winners, with more creative subjects such as Music and Art suffering from less entries.
These trends could be a result of the growing popularity of AI and space travel, or they could be the effects of the narrowing of the curriculum at Key Stage 4.
Methodology
- To compile this data, we’ve taken average grades and entry counts across a number of exam boards and qualifications and used the award’s “Subject” key to aggregate.
- In some cases, we are missing the actual results for subjects. These are counted as ‘null’ results values, but will be counted as an entry.
- ‘X’ and ‘U’ grades are not displayed on our charts.
- In all cases, we’ve used A Level data and not BTEC data.
- This is an early snapshot of the data and may change. We plan to review this data in the near future.
We take our insights from Arbor’s Data Warehouse, powered by Snowflake, which contains the anonymised data of schools in the Arbor community. As of today there are 6,707 English schools using Arbor, supporting over 2.5 million students. This data set represents 27.4% of the 24,453 schools in England. Our data includes 896 secondaries (26% of the 3,452 secondary schools in England), and 5,345 primaries (30.3% of the 16,764 primary schools in England). Arbor national averages track closely to DfE national averages.
–
About Arbor
At Arbor, we’re on a mission to transform the way schools work for the better, with brilliant, intuitive tools designed to make a difference.
We’re the UK’s most popular cloud-based MIS, and are used by over 6,000 schools and 400 MATs to work more collaboratively, free staff from unnecessary admin and make a measurable improvement to the way they work each day.
The post The Data Drop: A Level Results Day 2024 appeared first on Arbor.
]]>The post The Data Drop: Three insights that should be on the new government’s mind appeared first on Arbor.
]]>Too often, the challenge leaders face is not having the information to hand to know what’s working, and what’s not. With 6,500 schools using Arbor MIS, we’re able to provide live, national, statistically relevant data on the state of play in the education sector.
Our philosophy is that timely data and insights are critical to sparking conversations at school, MAT, LA and government level, and that the right data can help to shape the plans needed to support schools.
So we’re relaunching The Data Drop today to highlight recent trends in schools, and to share what we’ve learned – beginning with our starter for ten on the top challenges facing the new government.
–
1. Student attendance still hasn’t recovered from the pandemic – but the picture varies by school phase
Since the pandemic, schools widely report that attendance has declined. Our data shows that, for primary schools, attendance has performed consistently around the 94% mark. However, student attendance in secondaries has fluctuated and, broadly speaking, has been consistently lower than primaries at an average of 90%.
Looking more closely at secondaries, our data shows that as students move through school, their attendance gets worse – meaning Year 7s are the best attending year group. Year 11s have the worst attendance throughout the year, though the large lows in attendance in June and July 2023 reflect exam periods/study leave.
–

–
The number of persistent absentees paints a more worrying picture. While varying month on month, our data from September 2022 – June 2024 shows an average of 21.7% of the primary school pupil population are persistent absentees, with this rising to 30.7% of students in secondary schools.
We have defined students as persistent absentees in a given month if their attendance is less than 90% of total school days in that month.
–

N.B. Spikes seen around December and Easter months will in part be because there are less school days in this month, which means it takes fewer absent days for a student’s in-month attendance to drop below 90%
–
2. Staff absence due to sickness is decreasing, but wellbeing absences are increasing
Staff absence related just to sickness is consistently much higher in secondary schools, with expected peaks around the winter months. Staff absence remains much lower across primary schools.
–

–
Staff absence as a result of wellbeing has increased across both primary and secondary schools since 2021.
In June 2021, 0.1958 staff members were absent as a result of wellbeing in primary schools per 100 staff members. This increased to 0.7978 in June 2024.
In June 2021, 0.2621 staff members were absent as a result of wellbeing in secondary schools per 100 staff members. This increased to 1.772 in June 2024.
“Wellbeing” is defined as absence where a school has selected “wellbeing” as the absence reason.
–

–
3. Suspensions are on the rise
In 2023-2024, 7.4% of all secondary school students received at least one suspension. This has increased YoY since 2019-2020, when only 3.7% of secondary school students received at least one suspension.
Suspensions were most prolific for Year 10s, with 10.1% of Year 10 students having received at least one suspension in 2023-4.
As might be expected, there are significantly fewer suspensions in primary schools compared to secondary schools. However, the number of pupils with at least one suspension has still more than doubled from 2019-2020 (0.5%) to 2023-2024 (1.1%).
–

–
In secondary schools, 30% of child protection students have been suspended at least once this year, as have 21% of students in care, and 15% of SEN, Pupil Premium and FSM students.
–

–
With better access to data, we believe school, MAT, local authority and government leaders will be empowered to make better, faster decisions to improve schools and student outcomes. We’ll be publishing more insights in the coming weeks – watch this space!
–
Methodology
We take our insights from Arbor’s Data Warehouse, powered by Snowflake, which contains the anonymised data of schools in the Arbor community. As of today there are 6,707 English schools using Arbor, supporting over 2.5 million students. This data set represents 27.4% of the 24,453 schools in England. Our data includes 896 secondaries (26% of the 3,452 secondary schools in England), and 5,345 primaries (30.3% of the 16,764 primary schools in England). Arbor national averages track closely to DfE national averages.
–
About Arbor
At Arbor, we’re on a mission to transform the way schools work for the better, with brilliant, intuitive tools designed to make a difference.
We’re the UK’s most popular cloud-based MIS, and are used by over 6,000 schools and 400 MATs to work more collaboratively, free staff from unnecessary admin and make a measurable improvement to the way they work each day.
The post The Data Drop: Three insights that should be on the new government’s mind appeared first on Arbor.
]]>The post The Data Drop – Attendance of Pupil Premium eligible and SEN students appeared first on Arbor.
]]>This series is designed to share insights from our data warehouse (containing the data of c.4000 schools), to shed light on the wider patterns emerging across the education sector.
In this edition of The Data Drop, we’re looking at attendance, specifically for Pupil Premium eligible and SEN students – the data we’re presenting is from 1/09/2022 to 19/05/2023.
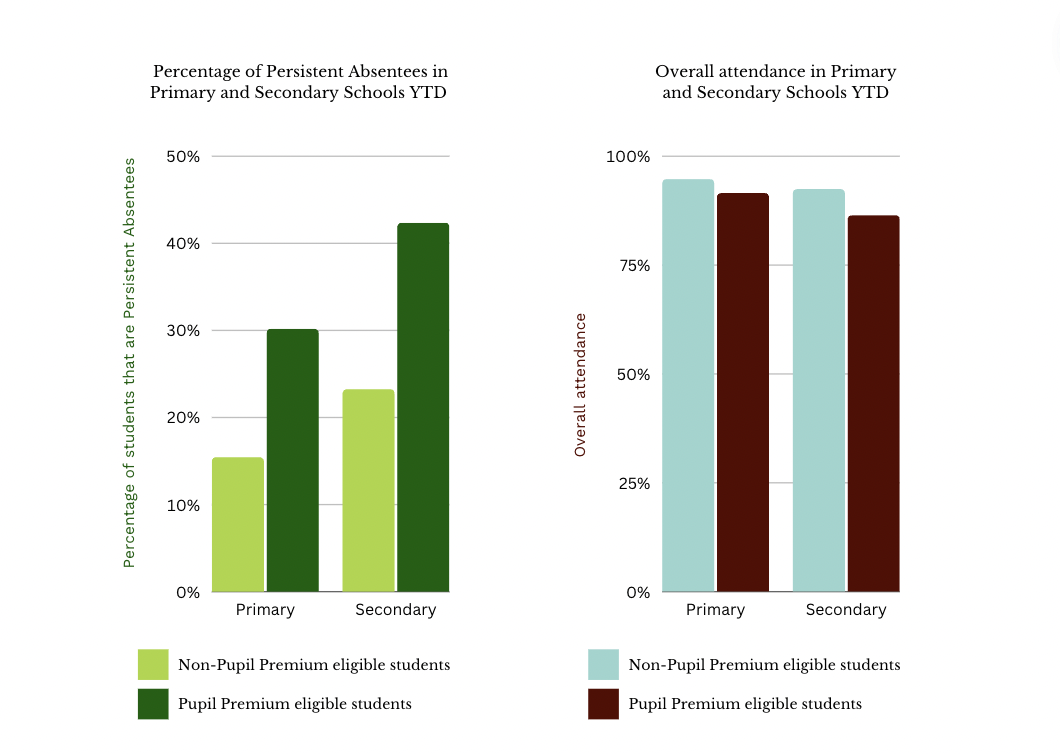
Before we look more closely at these categories, it’s worth noting the general trends across Primary and Secondary Schools in this time frame. Overall, attendance is lower in Secondary than in Primary Schools year to date – 90.4% compared to 93.7%. Plus, persistent absenteeism (students with less than 90% attendance) is far higher, with 30.6% of students in Secondary Schools identified as Persistent Absentees, compared with 19.4% in Primary Schools.
–
Pupil Premium eligible attendance
We wanted to take a closer look at how attendance patterns varied when separating out the data for Pupil Premium eligible students. In Primary Schools, the percentage of Pupil Premium eligible students who are persistently absent (30.1%) was nearly double that of those students who were not Pupil Premium eligible (15.4%). A similar trend can be seen in Secondary Schools, with 42.2% of Pupil Premium eligible identified as persistent absentees, compared with 23.3% of non-Pupil Premium eligible students.
Overall attendance was also significantly lower for Pupil Premium eligible students across both phases:
Primary Schools: 91.4% vs. 94.6%
Secondary Schools: 86.3% vs 92.3%
–
SEN attendance
Similar patterns also emerged when looking at the data of SEN vs. non-SEN students across both phases (not including Special Schools). In Primary Schools, 28.1% of SEN students are persistently absent, compared with 17.5% amongst non-SEN students. In Secondary Schools, 40% of SEN students are identified as persistent absentees, compared with 25.9% of non-SEN students. Though the difference is not as stark as with Pupil Premium eligible students, there is still a significant gap
The same can be said about overall attendance of SEN students vs. non-SEN students:
Primary Schools: 91.5% for SEN students vs. 94.2% for non-SEN students
Secondary Schools: 86.1% for SEN students vs 91.7% for non-SEN students

–
Methodology and terminology
Data is taken from 01/09/2022 – 19/05/2023
This data is taken from Arbor’s data warehouse – statistically accurate within 0.01% of the data from the Department of Education.
Present: Percentage of ‘present’ records out of all ‘possible’ records. This conforms to the DfE methodology for calculating attendance in the performance tables. Examples of ‘impossible’ sessions include those where the student is not of compulsory school age or where the school is closed (including for strikes).
Persistent Absenteeism: A student is considered persistently absent if their attendance is under 90%.
At Arbor, we’re on a mission to help schools make the most out of their data. Want to see how your school’s attendance data compares with other schools in the country? Find out more about Arbor’s Live National Benchmarks, built into your school MIS.
The post The Data Drop – Attendance of Pupil Premium eligible and SEN students appeared first on Arbor.
]]>The post The Data Drop: Staff absence in schools appeared first on Arbor.
]]>This new series is designed to share insights from our data warehouse (containing the data of c.4,000 schools), to shed light on the wider patterns emerging across the education sector.
–
Reasons for staff absence in schools
In a post-Covid world, and also in a year marked by strikes and an emphasis on staff wellbeing, we thought we’d use our first blog in our Data Drop series to take a look at staff absence data.
When looking at staff absence data based on the last five academic years between 1st September – 24th April (in order to be comparable to the 22/3 dataset at time of publication), there’s a significant downward trend in regards to sickness-related absences in school staff – but only when it comes to absences that have not been certified.

–
–
–
Only 26.8% of recorded staff absences in the academic year 2022-3 were as a result of sickness (certification unknown), dropping from 37.8% the previous year. This is a further jump from pre-Covid; in the academic year 2018-19, the proportion of working days lost attributed to sickness (certification unknown) was 46.7%.
By contrast, there has been a rise in other types of sickness absence since 2018. This is the case where absence has been medically certified as well as self-certified.
–
Absence due to school strikes
The other absence category which is seeing an unsurprising spike this academic year is absences related to strike action. In 22/23, 2.3% of working days missed were related to strikes. The proportion of working days missed by strikes has sat below 0.1% across the previous four years.
This equates to 41,193 days lost so far (to 24/04/2023) in 22/23 (across 3,631 many schools from where we drew this dataset), compared with a combined total of 260.5 days across the previous four years. Whilst these stats must also take into account the change in number of Arbor’s schools which make up the data, the difference is still notable. You can see more of Arbor’s data around the strikes in our work with SchoolsWeek here.

–
Other observations:
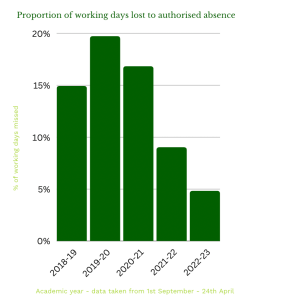
- Authorised absence: The proportion of working days lost to authorised absence has dropped significantly over the past five years, from its peak at 19.7% in 19/20 to 4.8% in 22/23
- Self-isolation: As can be expected given the dramatic fall in Covid cases, the proportion of absence as a result of self-isolation fell from 7.4% in 21/22 to 0.6% in 22/23
- Sickness types: Sickness due to cold, cough, flu, viral infection has dropped from 18.8% to 15.6% (22/23 vs 21/22)
- Interviews: Absence due to staff attending interviews at other schools is up to more than double pre-pandemic levels (0.5% in 22/23 vs 0.2% in 18/19 and 0.1% in 19/20). This could be due to the high number of vacancies in the sector, giving more agency to teachers in search of better pay and/or opportunities
- Wellbeing: Interestingly, wellbeing leave is up from 0.2% of total leave in 21/22 to 0.3% in 22/23. This could reflect an increased focus on wellbeing from schools, a reduction in overall wellbeing of school staff (leading to an increase in staff needing to take wellbeing days off/emergency wellbeing days), or a recognition from schools that they need to record leave taken specifically for wellbeing, that would have previously been recorded as other forms of leave. It’s also important to note that despite this growth, wellbeing leave still represents a very small proportion of working days lost
- TOIL: Time off in lieu absences are also up to more than double pre-pandemic levels (0.4% 22/23 vs 0.1% in 18/19 and 19/20). Though these numbers are very low, this could still be a nod to an increase in workload

–
Methodology
Periods covered – we’ve chosen to use these dates so that we have a comparable dataset to the 22/23 year at time of writing (May 2023).
22-23: 01/09/2022 – 24/04/2023
21-22: 01/09/2021 – 24/04/2022
20-21: 01/09/2020 – 24/04/2021
19-20: 01/09/2019 – 24/04/2020
18-19: 01/09/2018 – 24/04/2019
Staff absence is recorded using startdate, enddate and working days lost in between. Due to school holidays this is difficult to split days into the correct periods for long-term absence. Startdate has been used as an approximation for the academic year of the absence. The calculations attribute all working days lost to the period the startdate falls into.
The number of schools in our dataset varies year on year, which is why we have drawn on the percentage of days lost rather than number. Below you will find the number of schools in each year’s dataset.
18/19 – 3,385
19/20 – 3,424
20/21 – 3,503
21/22 – 3,611
22/3 – 3,631
This represents approximately 10% of the schools in the UK.
At Arbor, we’re on a mission to help schools make the most out of their data. Not yet using our MIS? Find out more here.
The post The Data Drop: Staff absence in schools appeared first on Arbor.
]]>