


We’ve crunched the numbers on over 3 million GCSE results to see how students have performed in their GCSEs this year versus last year.
Over the past two years, there’s been a lot going on for both students and schools. These are the first normal “post-COVID” GCSEs, where students will most likely have studied for two years in school.
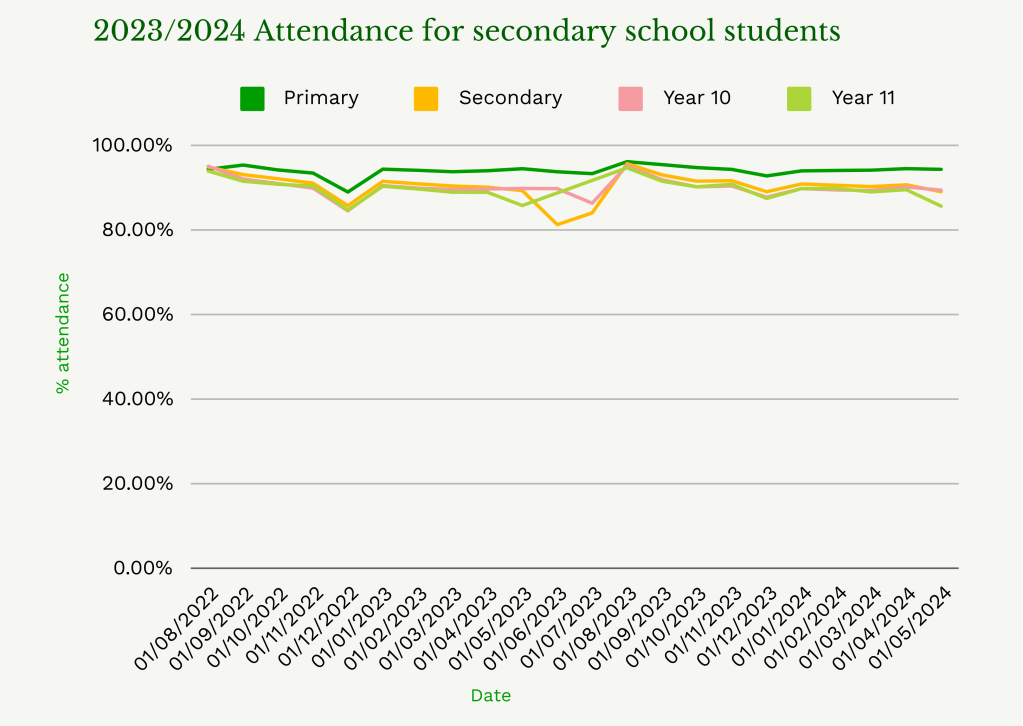
From our own analysis, we know that student attendance is still an issue for schools, particularly at Key Stage 4.
–
–
As you can see from the chart above, Year 10 and Year 11 attendance at secondary schools is below the national averages for primary and secondary schools.
Note: We have removed Year 11 study leave (June & July 2023)
–
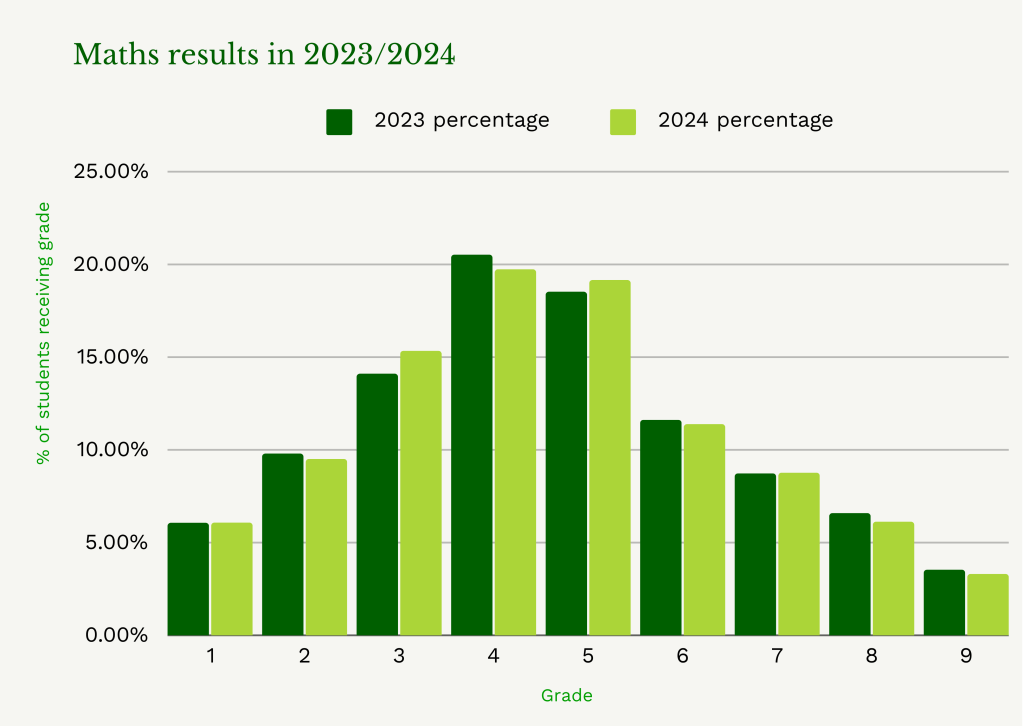
Maths
It’s a varying picture for the grade 4 / 5 borderline students. Compared with 2023, more students are achieving a grade 5 in Mathematics, with the percentage of students achieving a grade 4 dropping slightly.
However, there is a drop off in the number of students achieving grade 8 and grade 9 vs last year. This is in contrast to the A-level results where more students were achieving higher marks.
It’s hard to explain the grade spread here, could it be the shortage of Maths teachers with a degree is affecting Key Stage 4? Are the qualified Maths teachers being deployed to teach A-level?
–
–
–
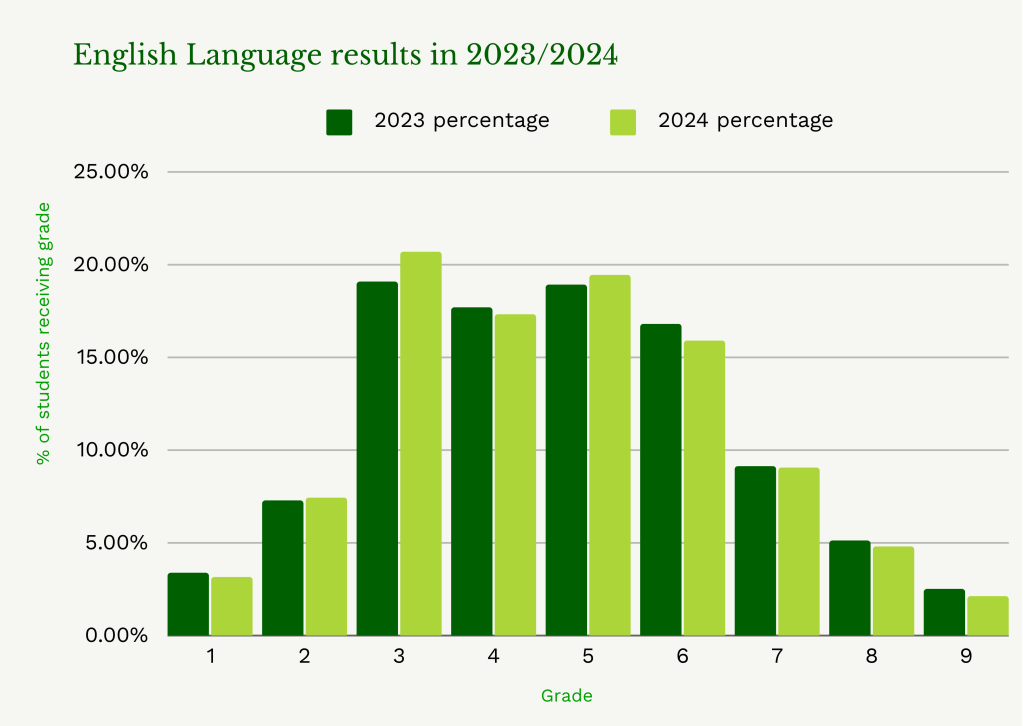
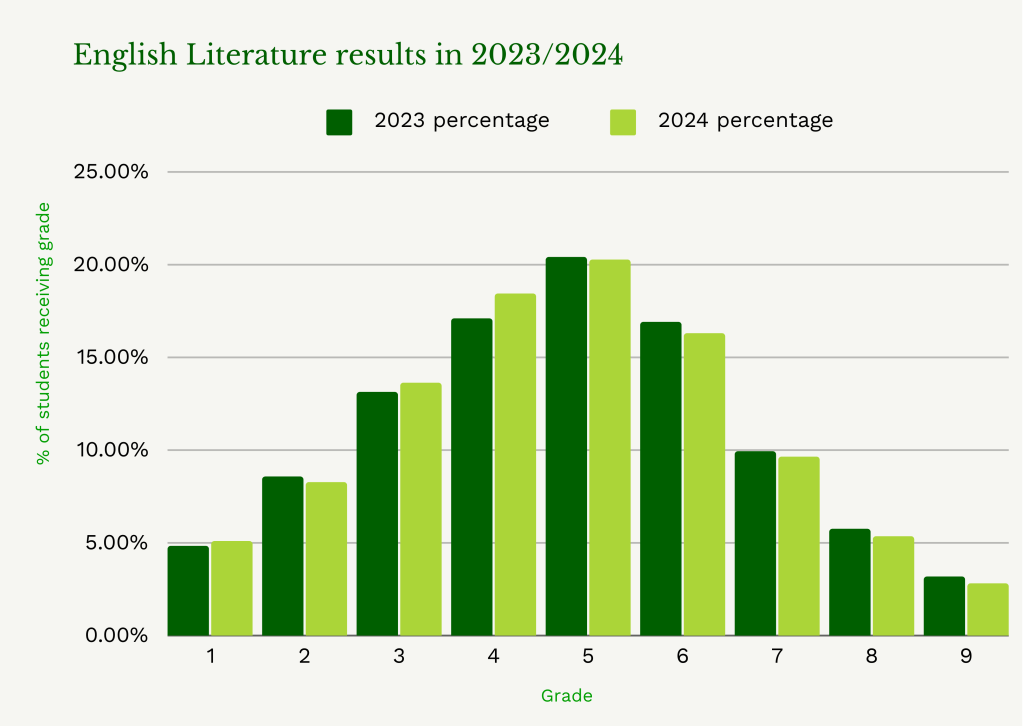
English
The results are similar in English, where the higher grades have seen a deflation at the expense of the lower grades.
Grade 5 in English Language has seen an increase vs last year, as has grade 4 in English Literature. This may be as a result of students aiming for a “pass” mark in each subject.
A higher percentage of students achieved grade 5 in English Language this year than last year. Could this be a result of effective interventions helping to get those borderline students up to grade 5?
–
–
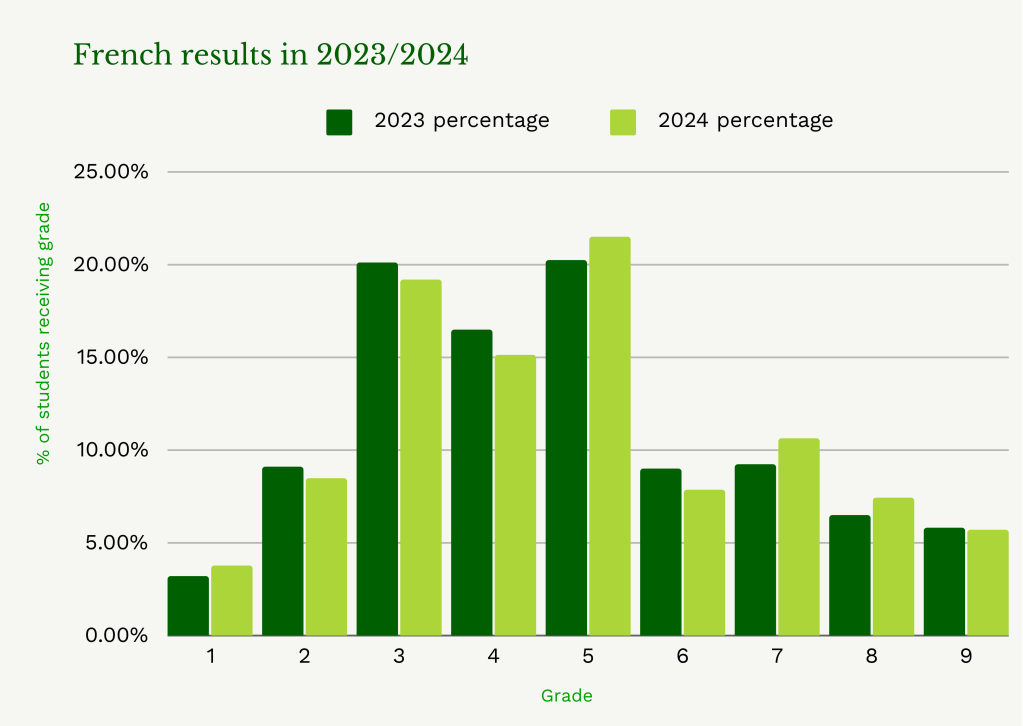
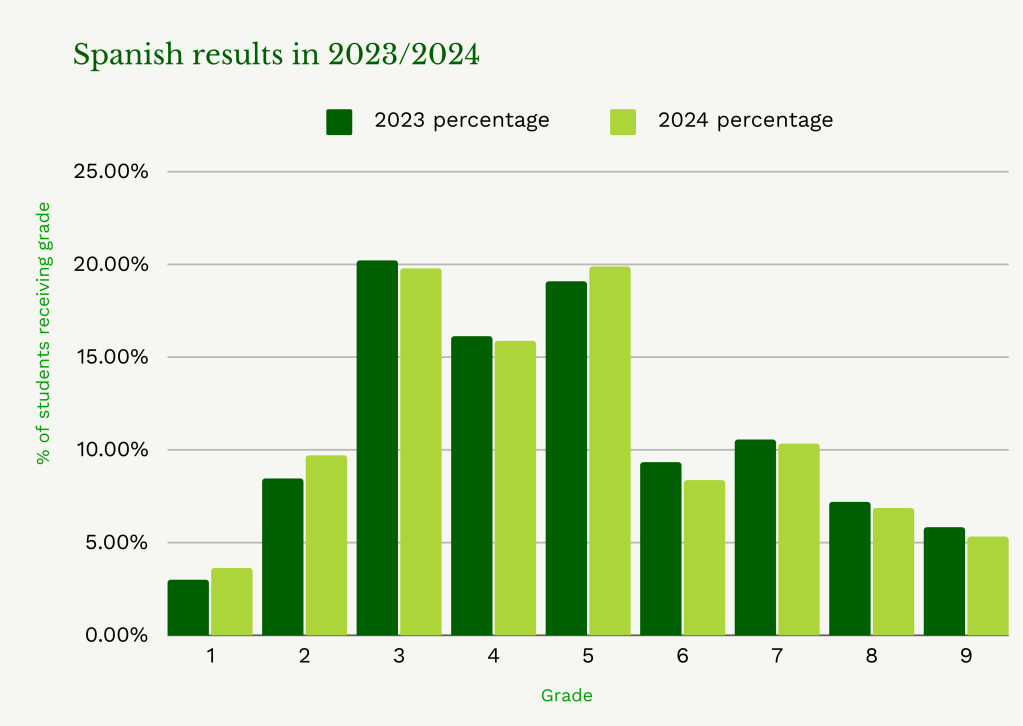
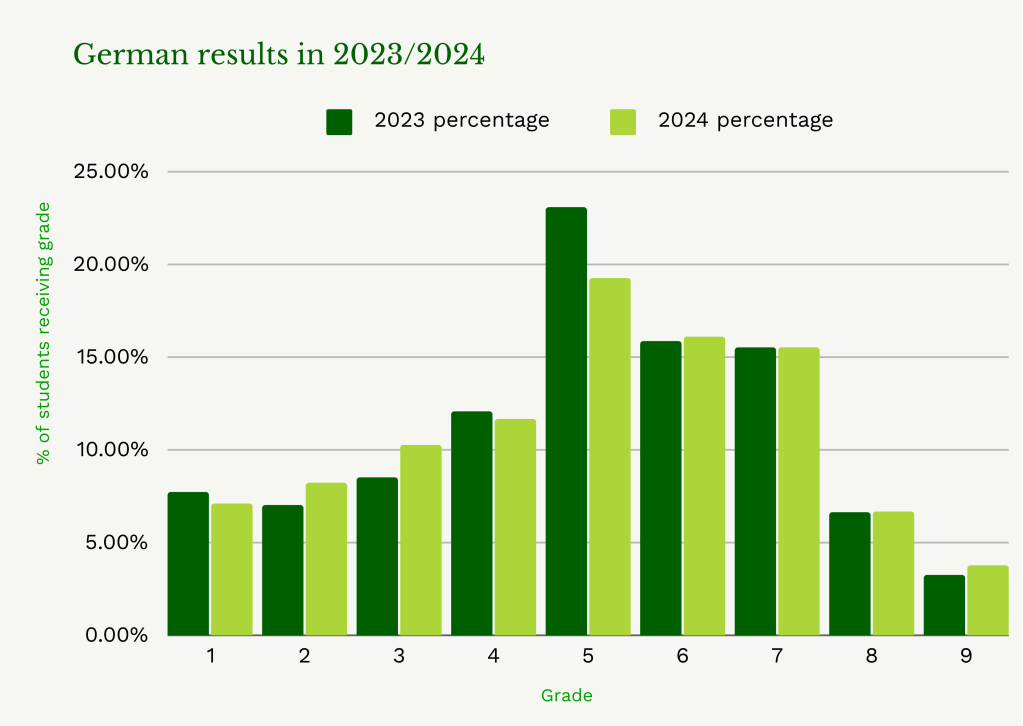
Languages
I wanted to pay attention to Modern Languages, particularly since it has been reported that there has been less language provision in secondary schools in recent years. Are students taking languages seriously? We know that schools would like them to, but there is a teacher shortage in languages.
From the data, we can see that both French and German have seen the higher-end grades improve on last year. This could be a result of having qualified teachers in certain subjects and not others.
–
–
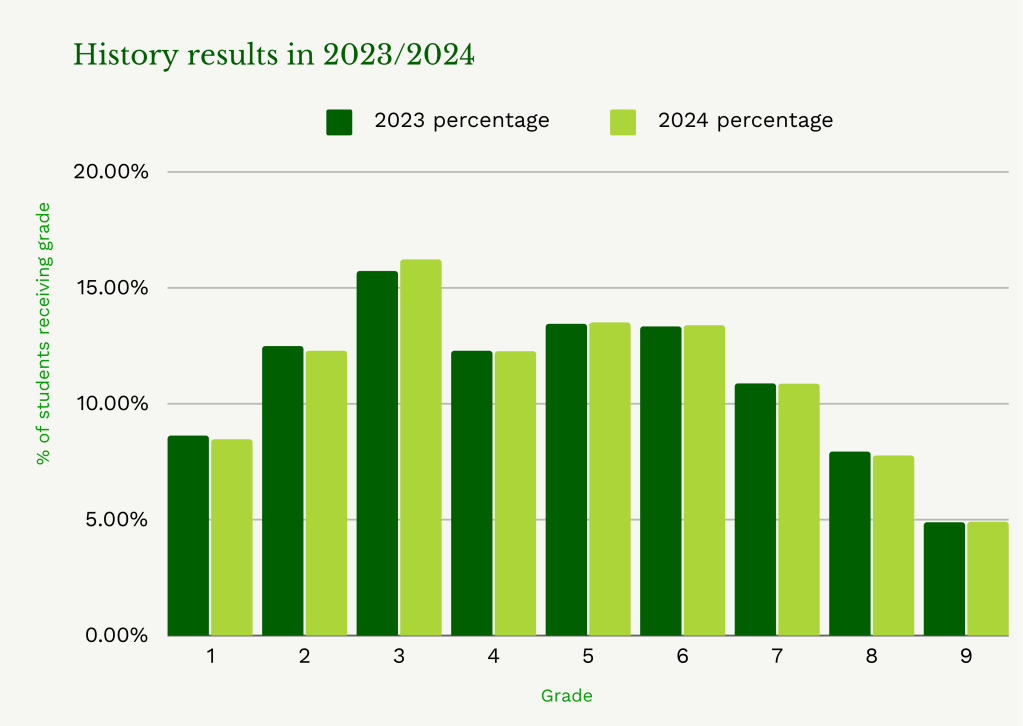
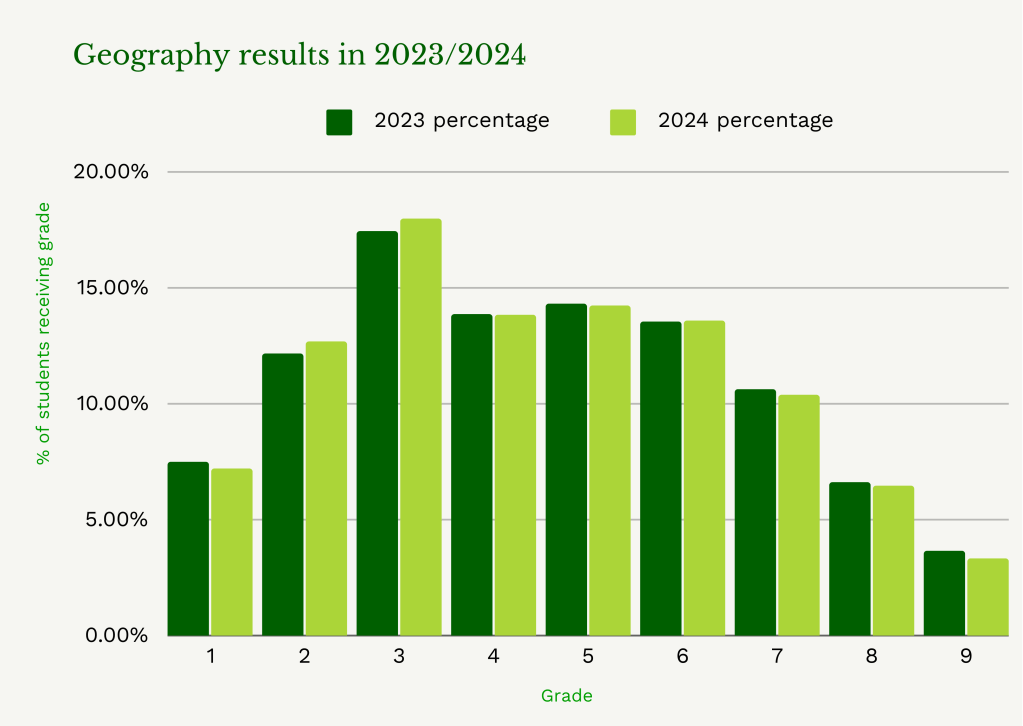
Humanities
Overall, it’s a mixed set of results for Geography and History. History has improved, where the number of students achieving a ‘string pass’ has increased since 2023, as did the number of students who achieved top marks.
Whilst Geography had more students achieving a grade 6 since last year, all of the other grades awarded grade 4 and above didn’t meet the previous year’s numbers. Again, this may be due to the national shortage of Geography teachers, with non-specialists covering lessons.
–
–
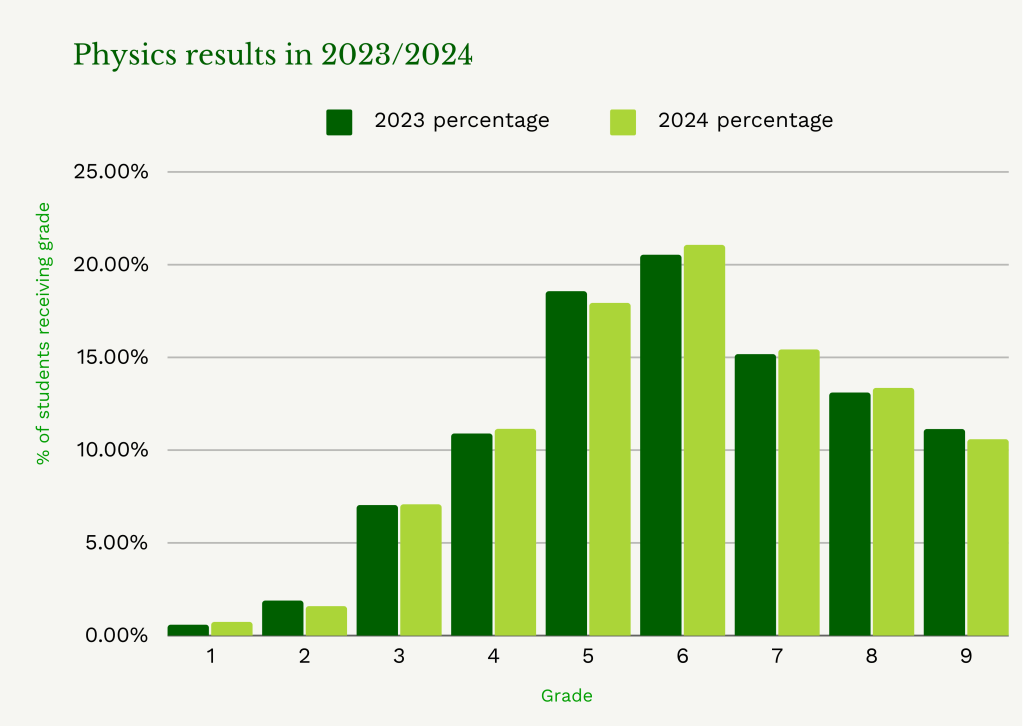
Science
The big takeaway from the sciences is that the Physics results have broadly improved from grade 6 and above (except grade 9). This mirrors the A-level results spread that we saw last week.
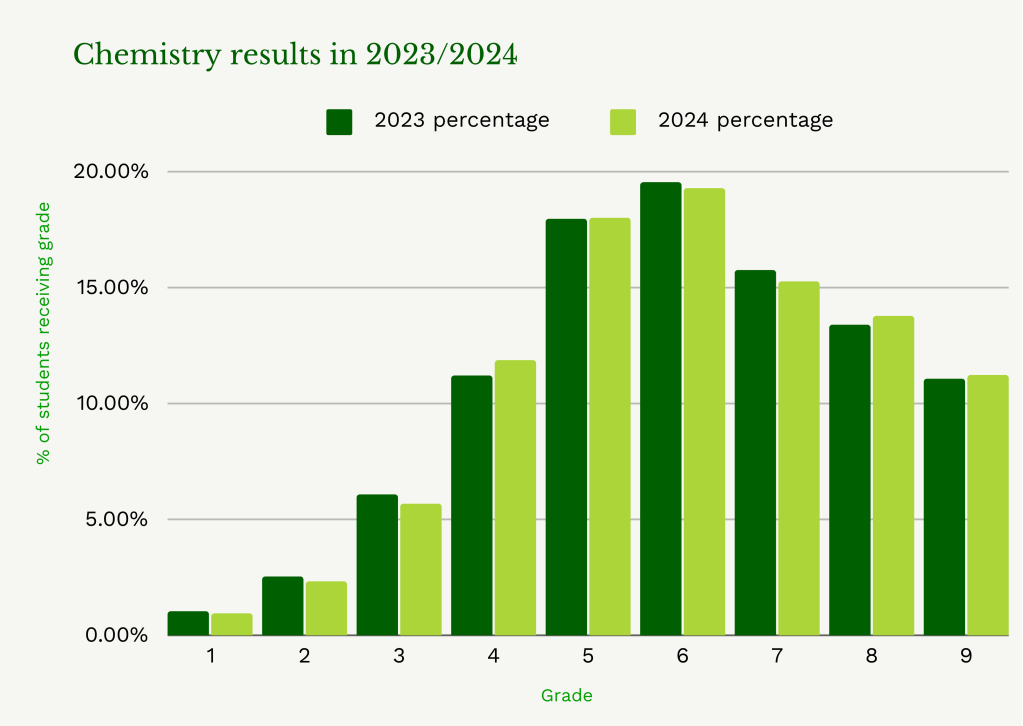
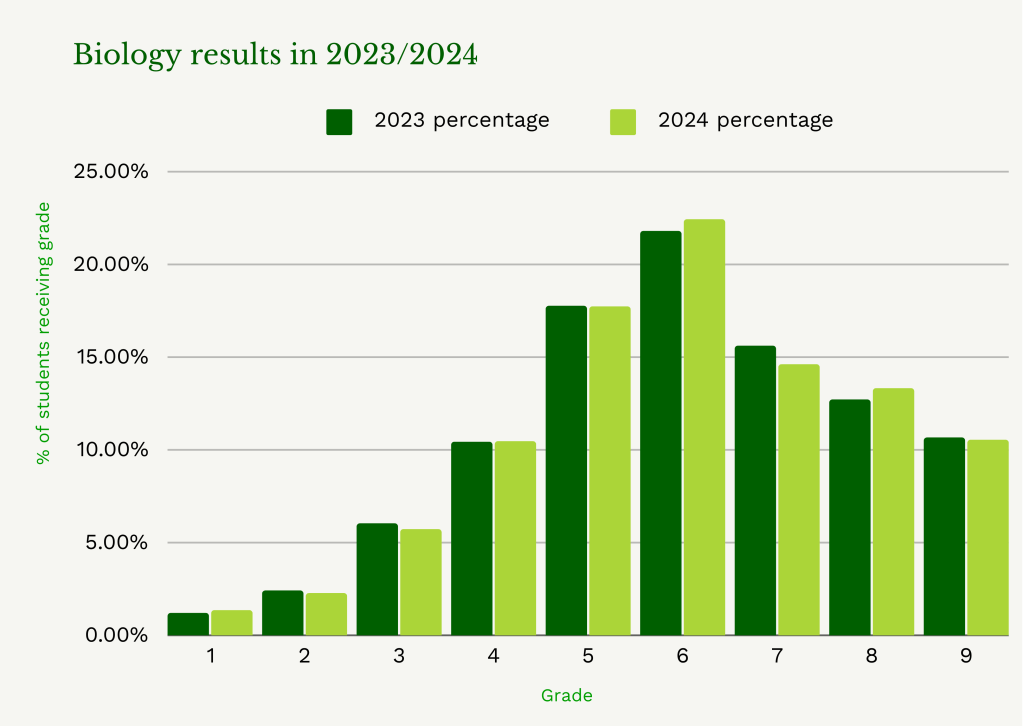
Both Chemistry and Biology have broadly fared better towards the higher end of the marks. This could be down to schools prioritising all three sciences across the curriculum.
–
–
Summary
It’s been a diverse picture across each subject. With a few exceptions, on average the higher grades haven’t quite matched last year. This may reflect the difficult few years that our Key Stage 4 students have been through or the continued dip in Key Stage 4 attendance.
It will be interesting to see how the national picture for GCSEs changes over the next two years as Attainment 8 remains, while Progress 8 is sidelined. How will this affect interventions for Year 10 and Year 11? Will it affect the entries and results of next year’s students?
Keep an eye on Arbor’s Data Drop blog as we dive into more of the data. e’ll be releasing a more in-depth analysis of the LKey Stage 4 results later this week.
–
Note:
- To compile this data, we’ve taken average grades and entry counts across a number of exam boards and qualifications and used the award’s “Subject” key to aggregate
- In some cases a result doesn’t have a grade, it will still be counted as an entry, but the result isn’t counted in our analysis
- ‘X’ and ‘U’ grades are not displayed on our charts
- In all cases, we’ve used GCSE data and not BTEC data
- This is an early snapshot of the data and may change. We plan to review this data in the near future. The analysis was correct at 15:30 on 21st August 2024

Leave a Reply