

Phonics results are in, and in this edition of The Data Drop, we’ve crunched the numbers to see how this year’s outcomes compare with previous years, including across different demographic groups.
If you’re new here, The Data Drop is our regular blog series where we share insights from our data warehouse, which holds data from over 9,000 schools.
And it won’t come as a shock that the DfE has confirmed that the phonics threshold for 2025 is 32.
–
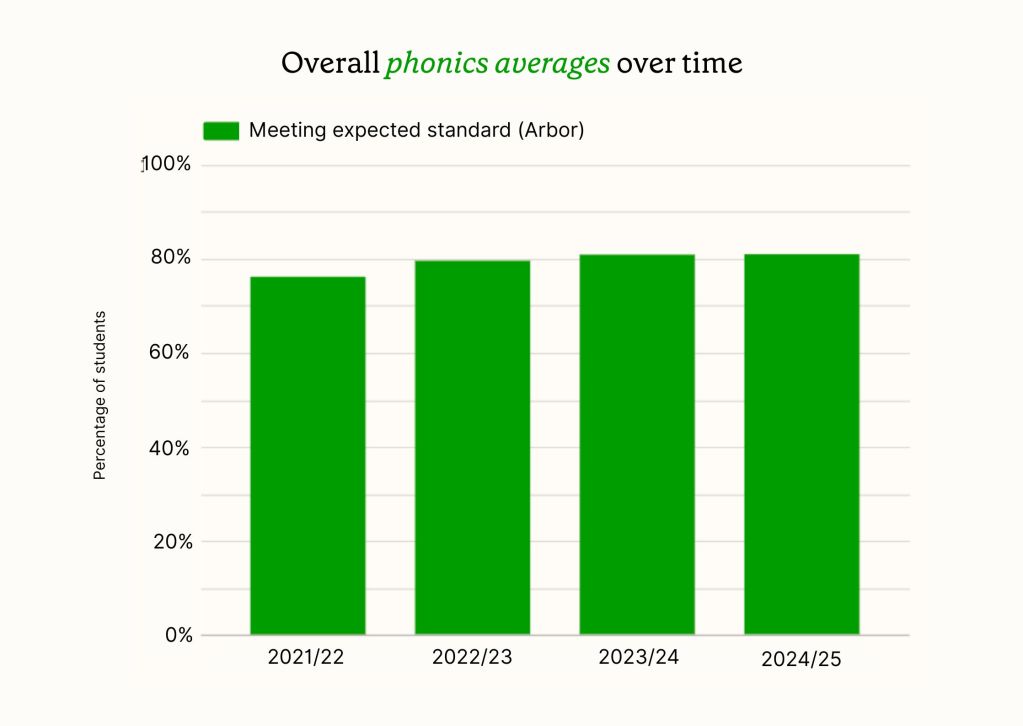
Overall phonics average
The 2024/25 phonics results show that 81% of students met the expected standard, representing a slight increase from 80.9% in 2023/24. This continues the upward trend we’ve observed since 2021/22, when 76.2% of students achieved the expected standard.
These results are based on data from 180,182 Year 1 students across 4,938 primary schools in the Arbor community, representing a substantial sample of the national picture.
–
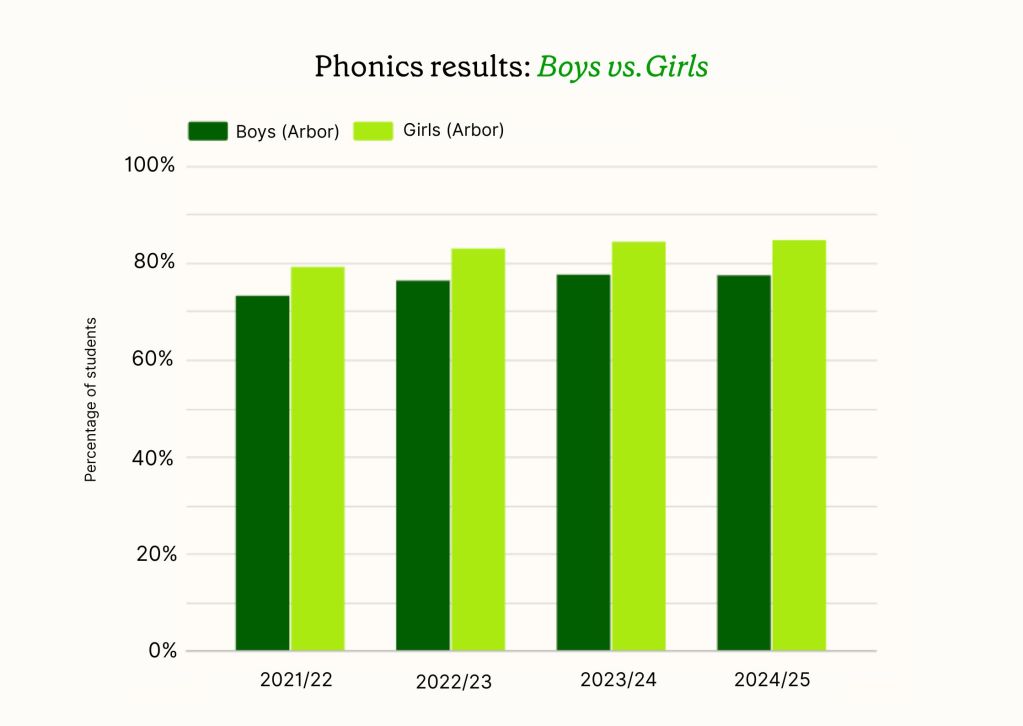
Phonics results: Boys vs Girls
The gender gap in phonics performance remains significant in 2024/25. Girls continue to outperform boys, with 84.7% of girls meeting the expected standard compared to 77.5% of boys. This represents a gap of 7.2 percentage points.
Whilst both groups have shown improvement over the four-year period, the gap has remained relatively consistent. In 2021/22, girls achieved 79.2% compared to boys at 73.2% (a 6.0 percentage point gap).
–
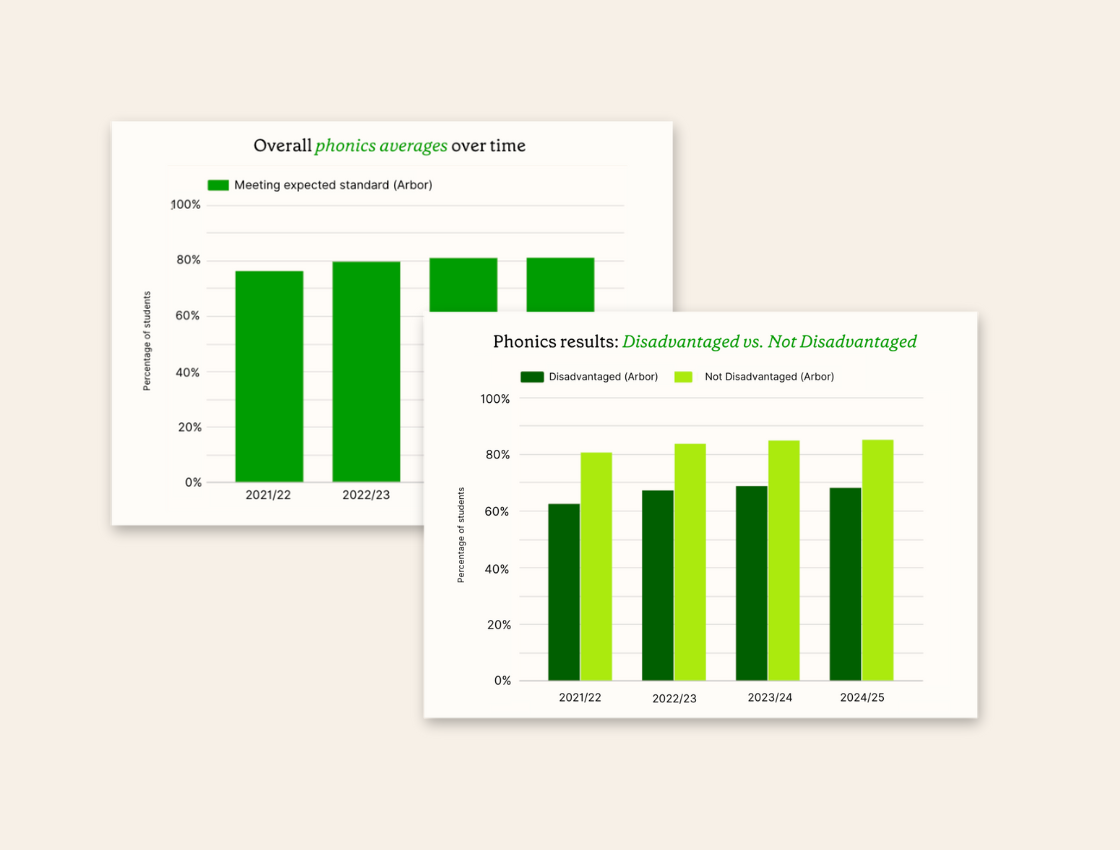
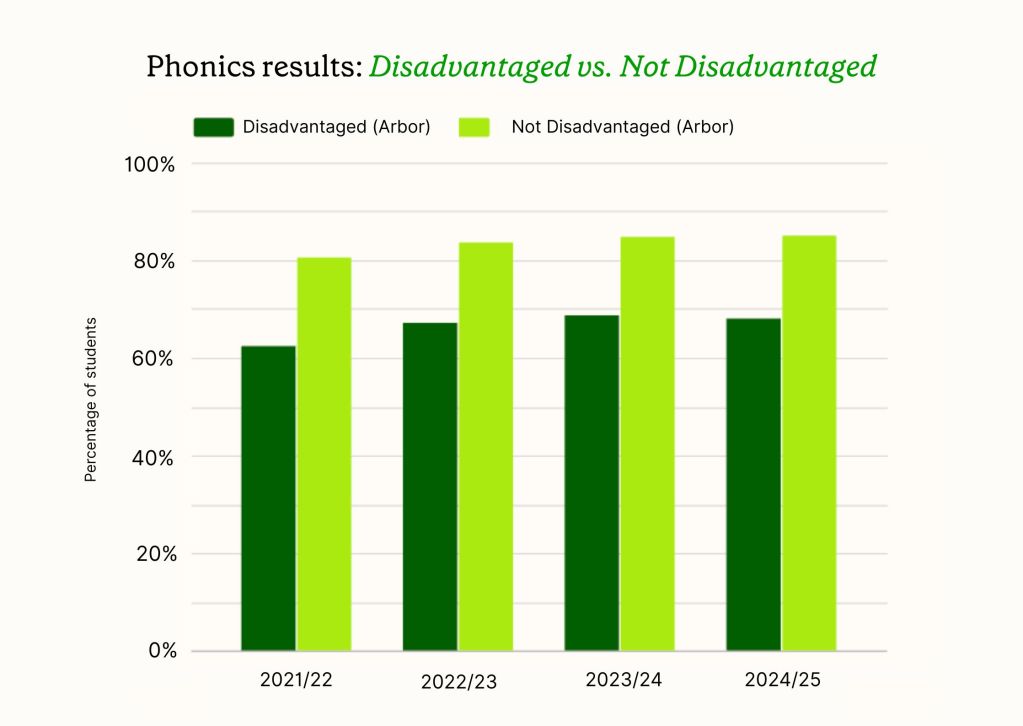
Phonics results: Disadvantaged vs not disadvantaged
The attainment gap between disadvantaged and non-disadvantaged pupils remains substantial. In 2024/25, 68.1% of disadvantaged pupils met the expected standard, whilst 85.1% of non-disadvantaged pupils achieved this level.
Notably, the results for disadvantaged pupils showed a slight decrease from 68.7% in 2023/24, whilst non-disadvantaged pupils maintained their upward trajectory from 84.8% to 85.1%.
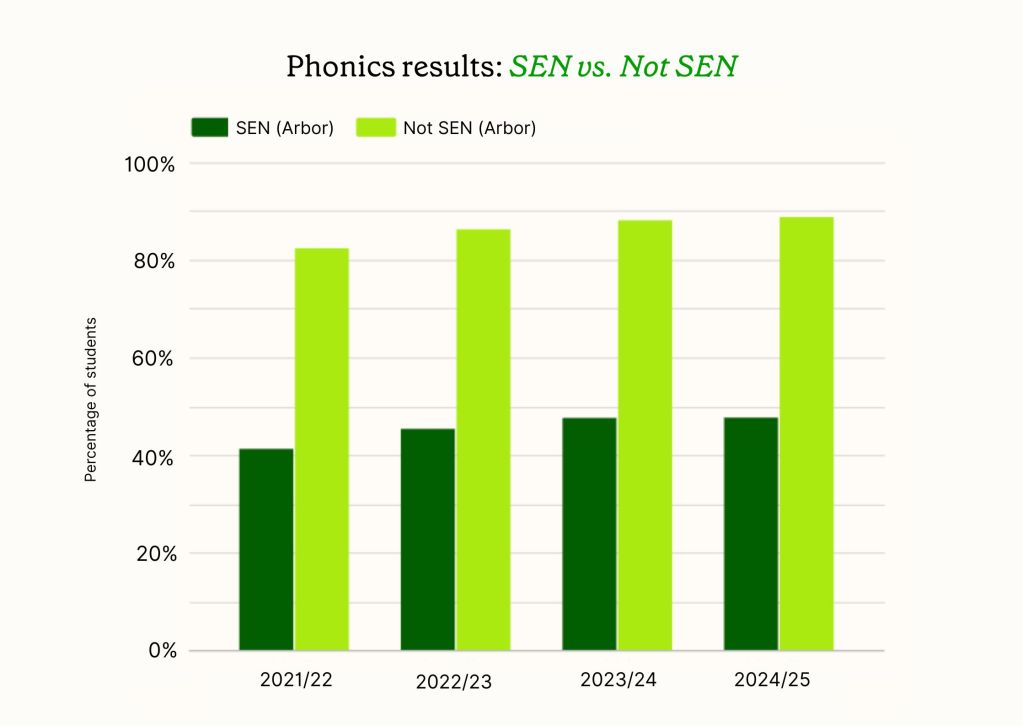
Phonics results: SEN students
Students with Special Educational Needs (SEN) continue to face significant challenges in phonics achievement. In 2024/25, 47.7% of SEN students met the expected standard, compared to 88.8% of students without SEN.
This represents a gap of 41.1 percentage points. SEN students showed minimal improvement from 47.6% in 2023/24, whilst non-SEN students continued their upward trend from 88.1% to 88.8%.
–
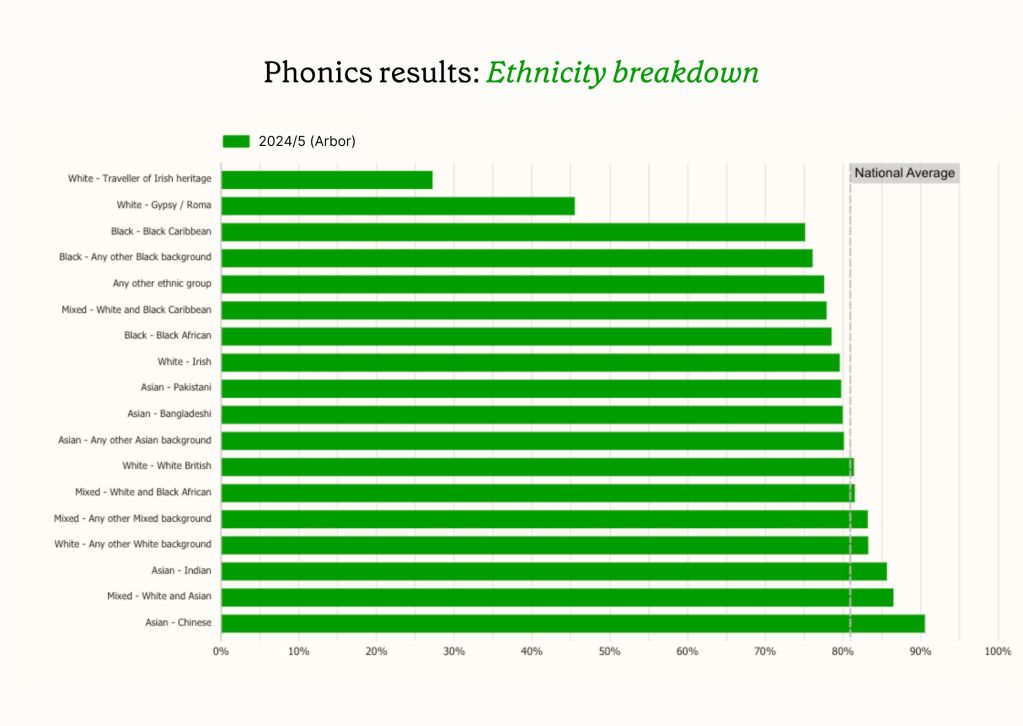
Phonics results: Ethnicity breakdown
The 2024/25 results reveal significant variation in phonics achievement across different ethnic groups:
Top 5 performing groups:
- Asian – Chinese: 90.6%
- Mixed – White and Asian: 86.6%
- Asian – Indian: 85.7%
- White – Any other White background: 83.3%
- Mixed – Any other Mixed background: 83.3%
Below national average:
- White – Irish: 79.7%
- Mixed – White and Black Caribbean: 78.0%
- Any other ethnic group: 77.6%
- Black – Black African: 78.6%
- Black – Any other Black background: 76.2%
- Black – Black Caribbean: 75.2%
Significantly below average:
- White – Gypsy/Roma: 45.6%
- White – Traveller of Irish heritage: 27.3%
The results highlight persistent achievement gaps, with students from Gypsy/Roma and Traveller backgrounds facing particular challenges in phonics attainment.
–
Methodology
We take our insights from Arbor’s Data Warehouse, powered by Snowflake, which contains the anonymised data of schools in the Arbor community. As of today there are 9,355 English schools using Arbor, supporting over 3.3 million students. This data set represents 38.4% of the 24,453 schools in England. Arbor national averages track closely to DfE national averages.
This results analysis was correct as of 24th June 2025 at 2 pm.